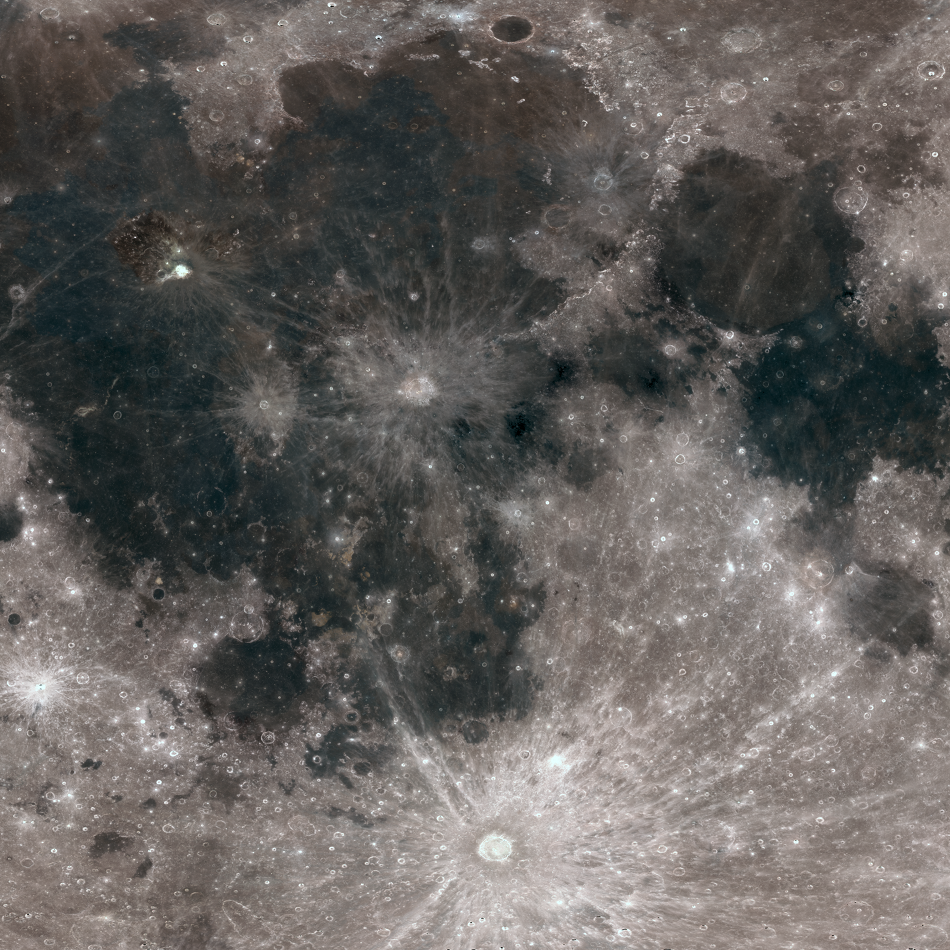
After nearly five years of LRO WAC observations, there are over 50 repeat multispectral observations for each ~480 by 480 m2 area on the Moon. The opening image is a new WAC RGB color composite mosaic using ~21 months of observations acquired during the 50 km quasi-circular orbit period.
One of the most arduous tasks for any planetary remote sensing imaging experiment is photometric correction. What exactly is a photometric correction (or normalization)? When mosaicking together images acquired at different times, image boundaries are often quite obvious because the Sun was in a different position and the camera pointing angles may also have varied. Thus the apparent brightness of the surface can be very different where images overlap.
As the lighting and viewing angles change, the reflectance seen at the camera changes in a non-linear manner (below, left). Photometric normalization adjusts the relative brightness of each pixel in such a way that the apparent camera (emission) angle and the Sun angle are the same in every pixel (e.g. incidence angle (i) = 60°, emission angle (e) = 0°, and phase angle (g) = 60°, see angle geometries below, right).

For making seamless mosaics or comparing the reflectance at two remote locations, photometric normalization is imperative. Sounds simple, right? In theory the normalization should be simple. However the apparent brightness of the surface as the incidence angle changes is also dependent on grain size, state of maturity, and composition. Many studies have tried to replicate this non-linear reflectance variation for the nearside or for a sample area of the Moon. Typically these corrections work well for that particular area, but not for other portions of the Moon.
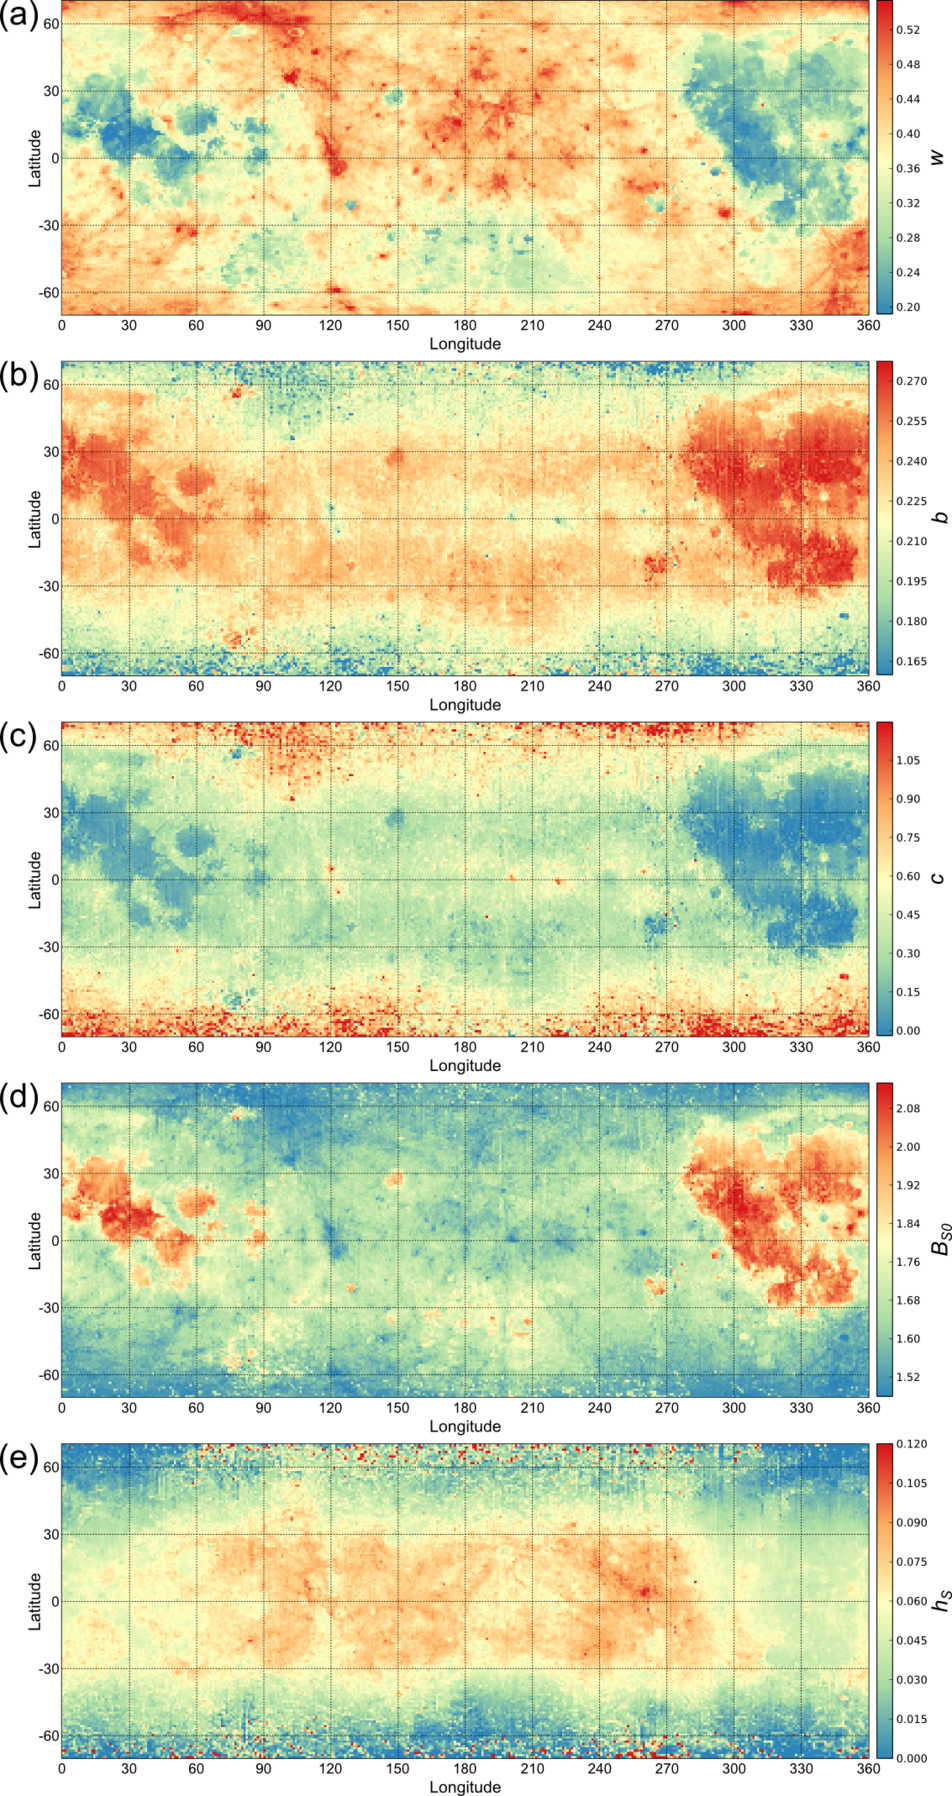
To make a global mosaic from the WAC data a new function was needed that accounted for all the variables mentioned above. But how can one account for changes in composition, for example mare vs. highlands? Since we have many complete image sets for the whole Moon, we could divide the Moon into 1° latitude by 1° longitude photometric tiles (64800 tiles). The wide field of view (60° in color mode) of the WAC results in more than 50% overlap with neighboring orbits, providing at least two (and often many more) different observations per 100-meter pixel for each spot on the Moon every month. Using LROC team member Bruce Hapke's photometric model [Hapke, 2012] (a widely applied theoretical model for planetary remote sensing), we parameterized the multispectral and multitemporal reflectance data from each tile (~30x30 km2 area; about 500,000 data points in average), resulting in the near-global Hapke parameter maps of the Moon (see next figure).

The opening WAC color mosaic was photometrically normalized using the Hapke correction and our derived parameter sets (shown in the maps above), achieving a beautiful seamless mosaic. The mosaic shows how well the correction works! Even better, the parameter maps tell us about the nature of the lunar surface. Each of the Hapke parameters has a physical meaning that relates to the material properties of the surface, for example the optical thickness and shape irregularity (b, c), grain size distribution (hS), and of course the albedo (w). This is the first ever resolved Hapke parameter map for any body in our Solar System - a major scientific accomplishment.
A recently published paper, Sato et al. [2014] in the Journal of Gephysical Research: Planets, describes the detailed methodologies of processing this gigantic data set, estimations of accuracy, the specific Hapke model used, and new discoveries.
Note that small "holes" in the mosaic are due to shadows or satauration in the original observations.
Published by Hiroyuki Sato on 28 September 2014