Before humans ever stepped foot on the Moon, a series of precursor missions were flown to answer key engineering questions about the lunar surface. In an effort to answer similar questions about future exploration sites, the Lunar Reconnaissance Orbiter was launched in June of 2009. One of the primary objectives was to collect key measurements needed to plan future exploration activities, which include information regarding the illumination and thermal environment as well as the local topography of the polar regions.
Using a subset of the LRO data products, a new tool was developed that enables detailed design of future surface traverses. The tool integrates topography models from the Narrow Angle Camera (NAC) and Lunar Orbiter Laser Altimeter (LOLA) and surface temperature data derived from the Diviner Lunar Radiometer Experiment (Diviner). Using the local topography from NAC and LOLA digital terrain models and surface properties derived from results obtained during the Apollo and Luna missions, we can now estimate the energy required to traverse between different science and exploration targets using a terramechanics model. In addition, by integrating various LRO data products, we can examine the illumination conditions along the traverse at any point in time, which is important when simulating a rover’s energy use and storage.

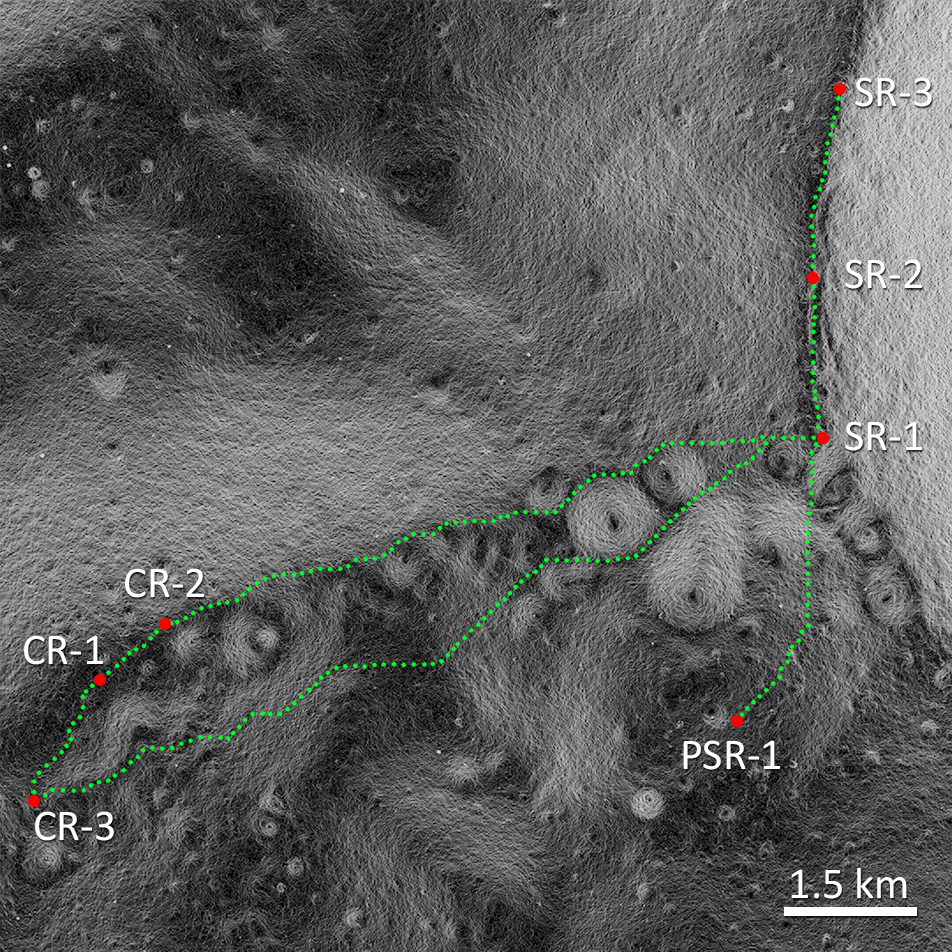
As an example of what this kind of analysis can accomplish, we examined traverses in the lunar south polar region. In this test case we examined local slopes and simulated the lighting environment between 1 January 2021 and 31 December 2021. The Diviner temperature estimates allowed identification of key science targets where ice is potentially stable at the surface, or at very shallow depth (< 1 m). Combining these products and estimates we were able to identify optimal traverses that kept the simulated rover illuminated for 94.4% of the year while enabling access to regions of near permanent shadow. We are currently evaluating traverses around other key science targets across the Moon.
Movie Caption: Green dot shows location of rover during a simulated exploration traverse, when the dot turns red the rover is in shadow (only 6% of the year with the longest eclipse lasting 101 hours). The rover is moving between a series of persistently illuminated points along the connecting ridge between Shackleton and de Gerlach crater. This particular simulation was for a rover with limited roving capabilities. Studies such as this show the power of combining measurements collected by the suite of LRO instruments, which enable critical detailed surface exploration planing activities. Lighting simulation created from LOLA laser ranging topography by Technische Universität Berlin, image is ~10 km top to bottom.
The full paper in the LRO special issue of Icarus:
Speyerer E. J., S. J. Lawrence, J. D. Stopar, P. Gläser, M. S. Robinson, B. L. Jolliff (2016) Optimized traverse planning for future polar prospectors based on lunar topography, Icarus 273, 337–345, doi:10.1016/j.icarus.2016.03.011.
Related Featured Images
Published by Mark Robinson on 13 July 2016