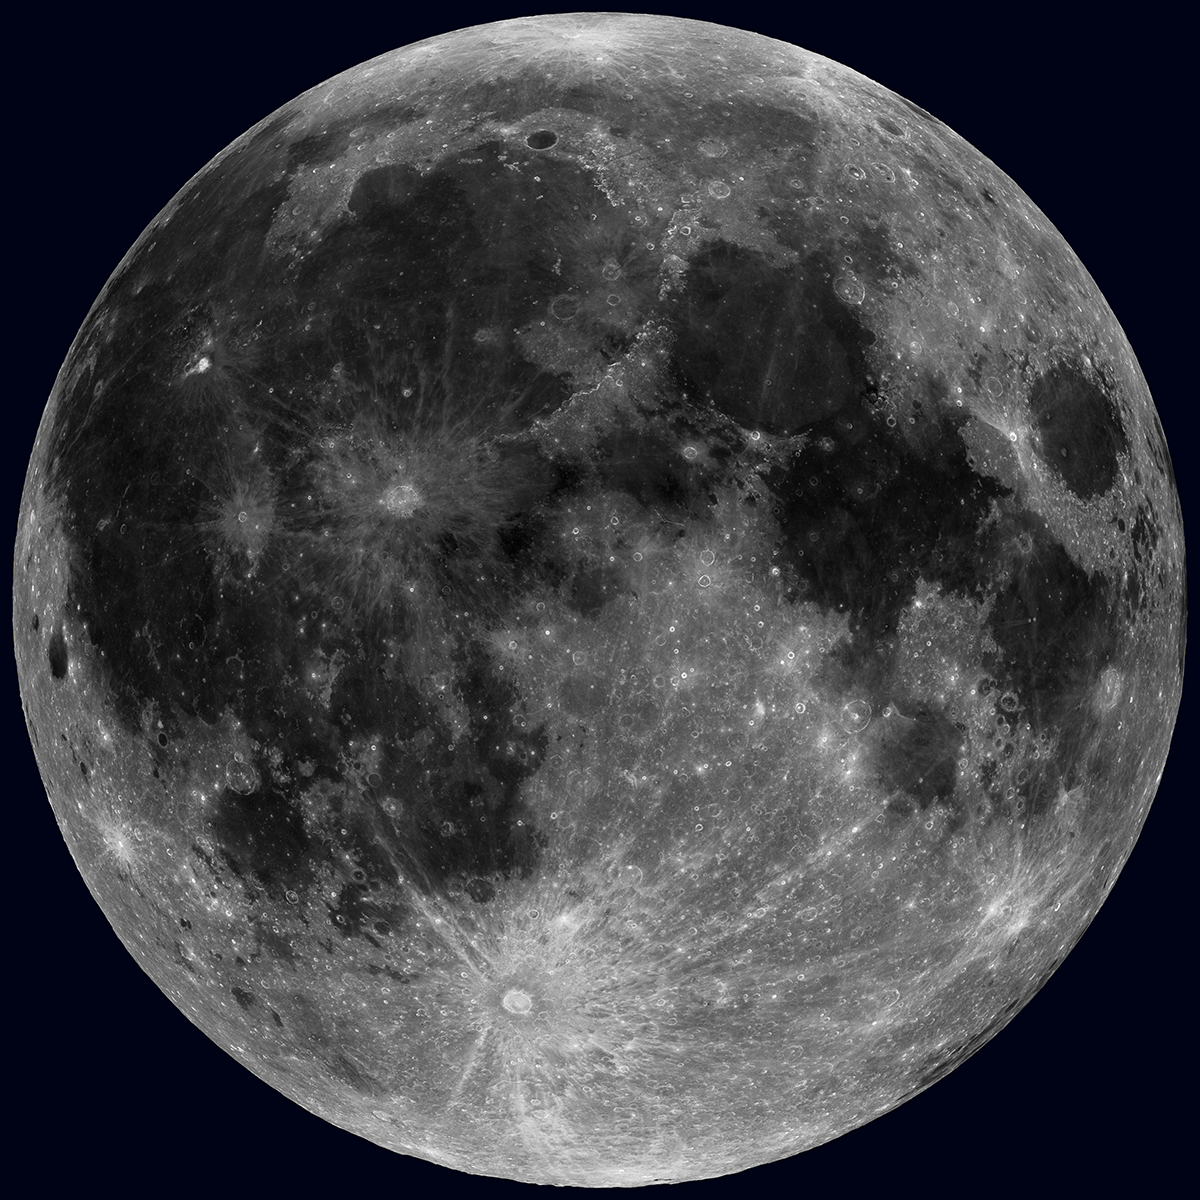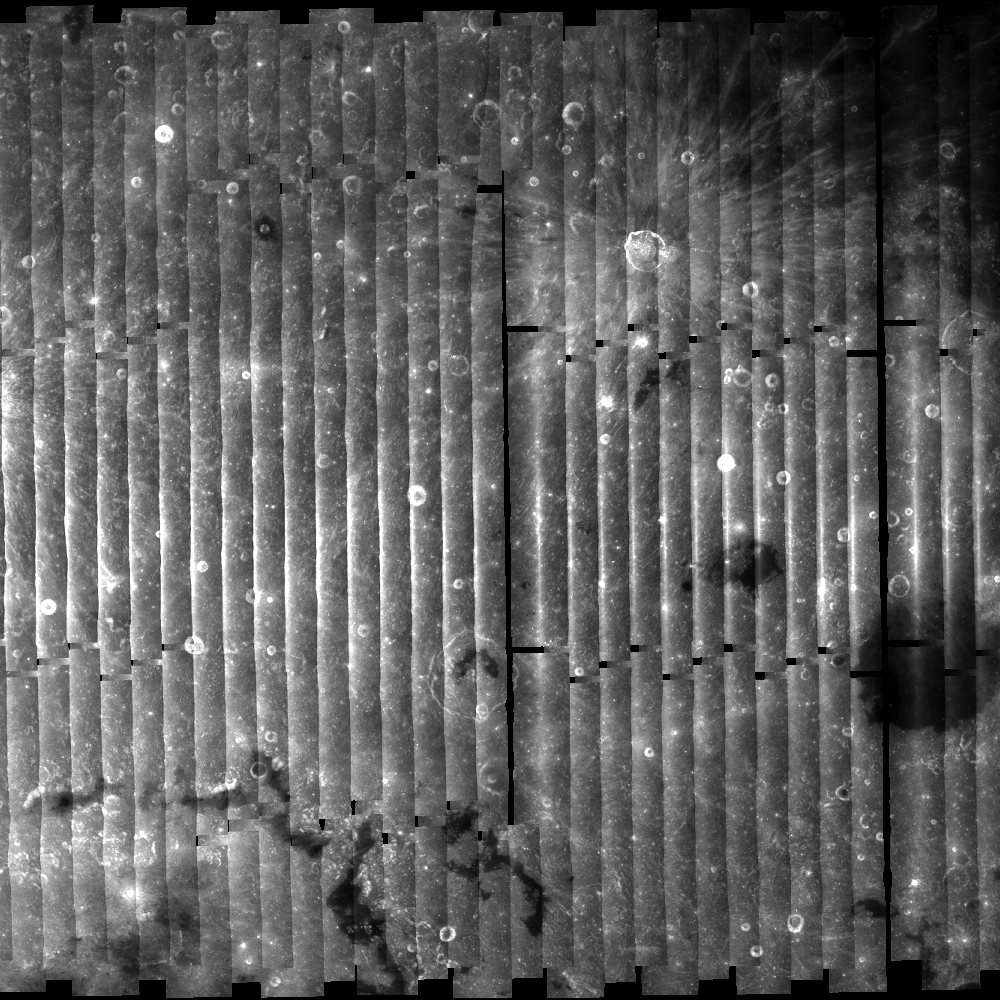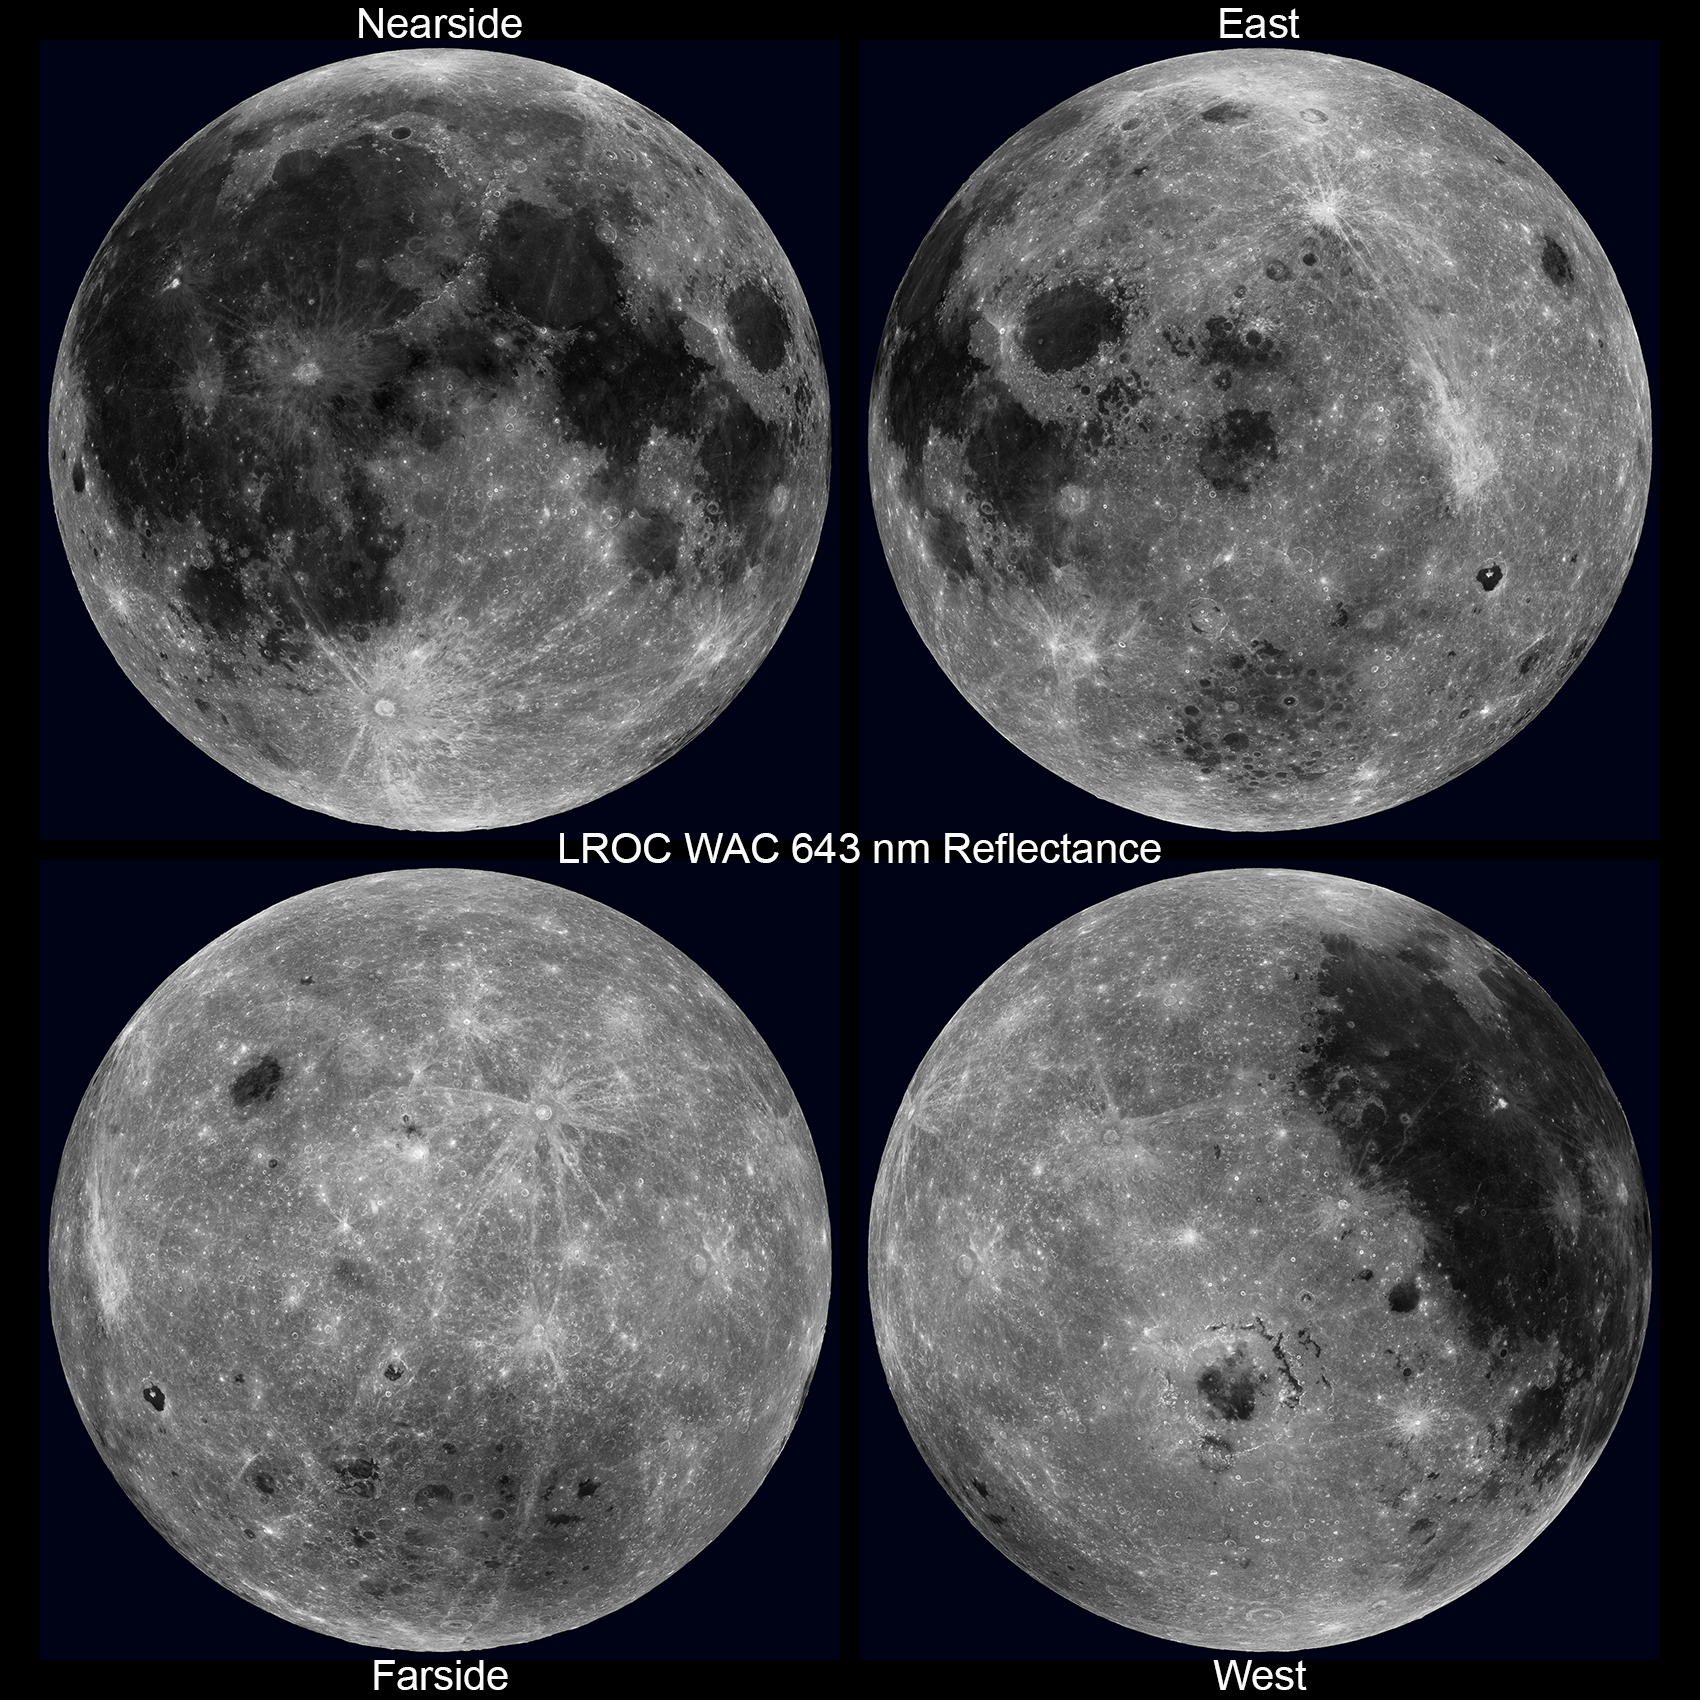
A huge payoff from the longevity of the LRO mission is the repeat coverage obtained by the LROC Wide Angle Camera (WAC). The WAC has a very wide field-of-view (FOV), 90° in monochrome mode and 60° in multispectral mode, hence its name. On the one hand, the wide FOV enables orbit-to-orbit stereo, which allowed LROC team members at the DLR to create the unprecedented 100 meter scale near-global (0° to 360° longitude and 80°S to 80°N latitude) topographic map of the Moon (the GLD100)! However, the wide FOV also poses challenges for mosaicking and reconstructing lunar colors because the perspective changes plus- and minus-30° from the center to the edges of each frame. The problem lies in the fact that the perceived reflectance of the Moon changes as the view angle changes. So for the WAC, the surface appears to be most reflective in the center of the image and less so at the edges, which is quite distracting! This effect results in a pole-to-pole striped image when making a "not-corrected" mosaic.
What to do? Easy - simply take 36 nearly complete global mosaics (110,000 WAC images) and determine an equation that describes how changes in Sun angle and view angle result in reflectance changes. Next step, for each pixel in those 110,000 WAC images compute the solar angle and the viewpoint angle (using the GLD100 to correct for local slopes), and adjust the measured brightness to common angles everywhere on the Moon. For this mosaic the LROC Team used the 643 nm band, a solar angle 10° from vertical (nearly noon), and a viewing angle straight down. Well, perhaps easy is a bit of an exaggeration!
Imagine the number of pixels to consider! To reduce the computational load we use only a subset of the pixels to fit. The most challenging aspect is determining the best photometric model for this huge dataset. Using existing knowledge of lunar reflectance, many iterations, and a variety of classes of mathematical solutions, we ended up using a combination of output from a least-squares fit on a linear model as starting parameters to a minimum search algorithm on a non-linear model. This technique adds robustness to the non-linear model and enables us to more quickly converge on a solution. Or in other words, there were a lot of calculations over many starts and restarts. So perhaps the process was not that easy in practice, but in the end, it was successful! This type of study is known as photometry, and has a rich history going back to the first half of the 20th century.
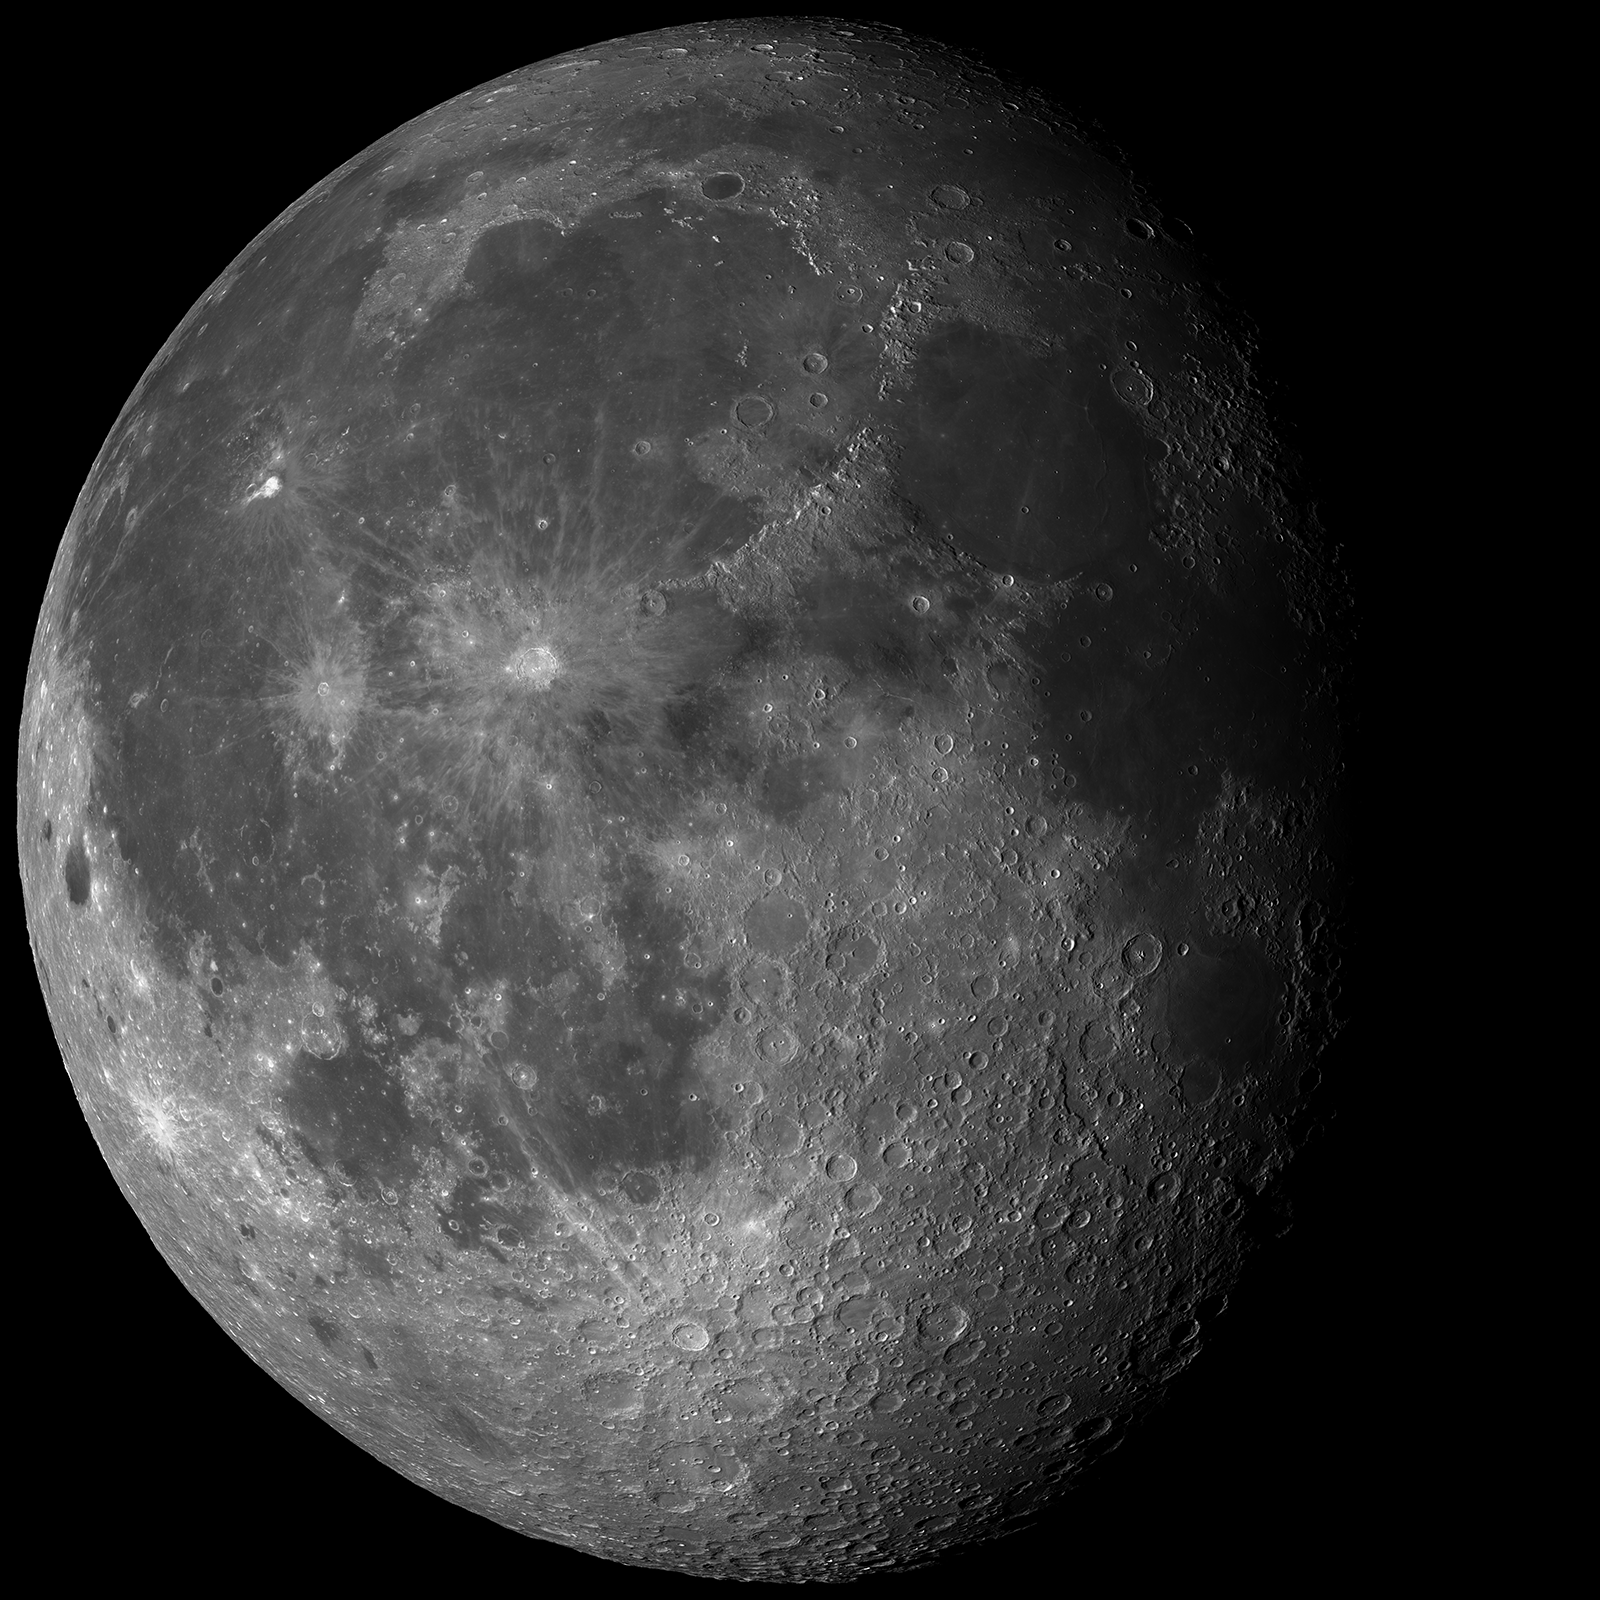
With the Sun overhead, topography variations are hard to see, but differences in albedo (relative reflectance) are enhanced. Look closely at the reflectance map (above) versus a version of the same map but with natural shading added back (using the WAC topography, below). In the purely reflectance map, mare (low reflectance) and crater rays (high reflectance) really stand out! The mare appear as they do because of their high abundance of iron (iron [Fe2+] in minerals such as pyroxene, and iron metal [Fe0] as a product of space weathering), and in many areas titanium (in the mineral ilmenite). Both elements are strongly absorbing in visible wavelengths. Crater rays are generally composed of the same materials upon which they rest, but they have not undergone as much space weathering, yielding a reflectance contrast. Space weathering lowers the reflectance over time, so just wait around a few hundred million years and watch Tycho's rays disappear!
Stay tuned. Late this fall, full seven-color WAC mosaics will be available resulting from this same photometric solution. Read more on the empirical normalization process.
Large version of the nearside reflectance map.
Please view this spectacular rotation movie in HD format!
Related posts:
LROC WAC Global Topography (GLD100)
WAC Global Mosaic
Published by Mark Robinson on 17 July 2013


