Colors on the Moon are dominantly controlled by variations in iron and titanium content. The mare regions have low reflectance because they contain relatively high amounts of iron oxide (FeO). Some mare basalts contain unusually high amounts of titanium oxide (TiO2) in addition to iron oxide, making for even lower reflectance. TiO2 also shifts the color of the mare from red to blue.
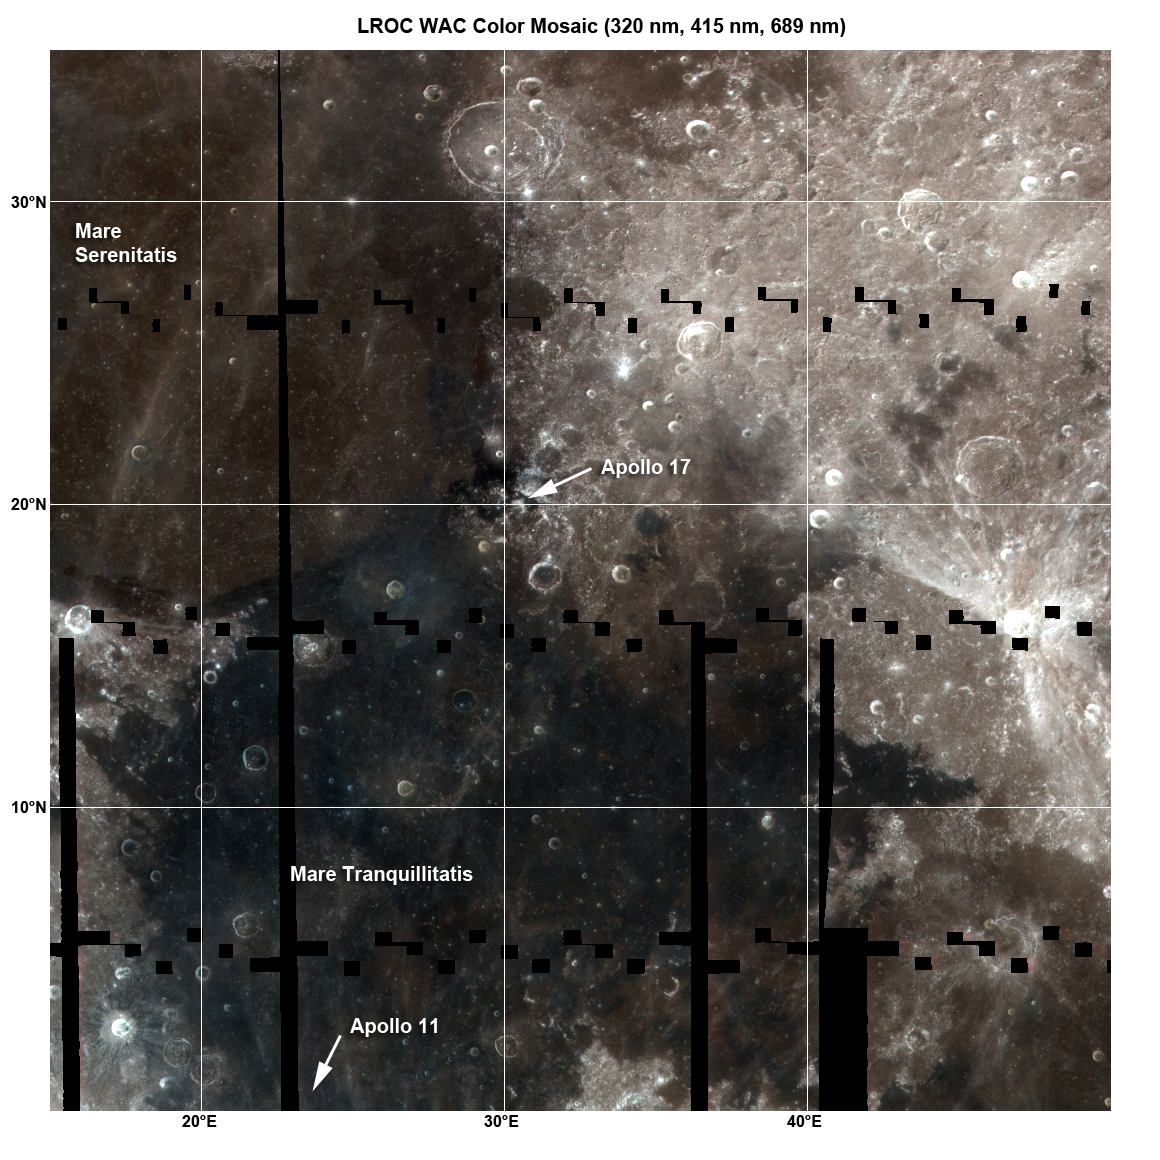
The distinct boundary between Mare Tranquillitatis (darker and bluer) and Mare Serenitatis (lighter brown) is clearly visible in the WAC color image and results from high TiO2 in the Tranquillitatis basalts. Scientists have studied the Tranquillitatis basalts in detail from the rocks returned by the Apollo 11 astronauts; the composition of the Serenitatis rocks are known only from orbital remote sensing. One of the goals of the WAC is to provide a global map of UV and visible reflectance to help scientists better understand the distribution of iron and titanium in the mare. From the Apollo samples, we believe that titanium is dominantly held in the mineral ilmenite. However, we have not sampled the full variety of lunar basalts so we can not be sure - more samples are needed.
Grain size and physical state of the surface material also effect the reflectance (or albedo). Note how the region near the Apollo 17 landing site is anomalously dark. Is this effect simply from extremely high abundances of iron and titanium? Yes and no -- yes, the materials sampled do have high titanium and iron, but no, higher abundances have been sampled at the Apollo 11 site. The big difference is in the physical state of the material. Mixed into the soils in this area is a high percentage of pyroclastic materials (lava that was blown out of a vent and rained down over a wide area). The magma drops cooled in flight and formed little beads of glass and small crystals. These beads had high titanium abundances and are very low in reflectance, giving this area its distinctive dark signature.

The Apollo 12 samples (i.e. 12017) were generally lacking in ilmenite while the Apollo 11 basalts (i.e. 10018) had an unusually high percentage. The total weight percent (wt%) of TiO2 in the Apollo 11 rocks exceed 10%. How does this compare with terrestrial basalts? Most have less than 1 wt% TiO2, and a terrestrial basalt with 3 wt% is considered very high. So what is up with the lunar variety? Basalts come from melting of mantle rocks which are squeezed up to the surface. Sampling basalt is a convenient way to sample the mantle! The fact that lunar basalts sometimes have very high titanium tells scientists that the processes that work to segregate elements in the mantle are very complicated; the Moon is not a simple body. Right now the complex history of lunar formation and how its interior evolved are not well understood. By pinpointing areas on the surface that have varying amounts of titanium with the LROC WAC, future mission planners can better plan sampling spots for humans and robots.
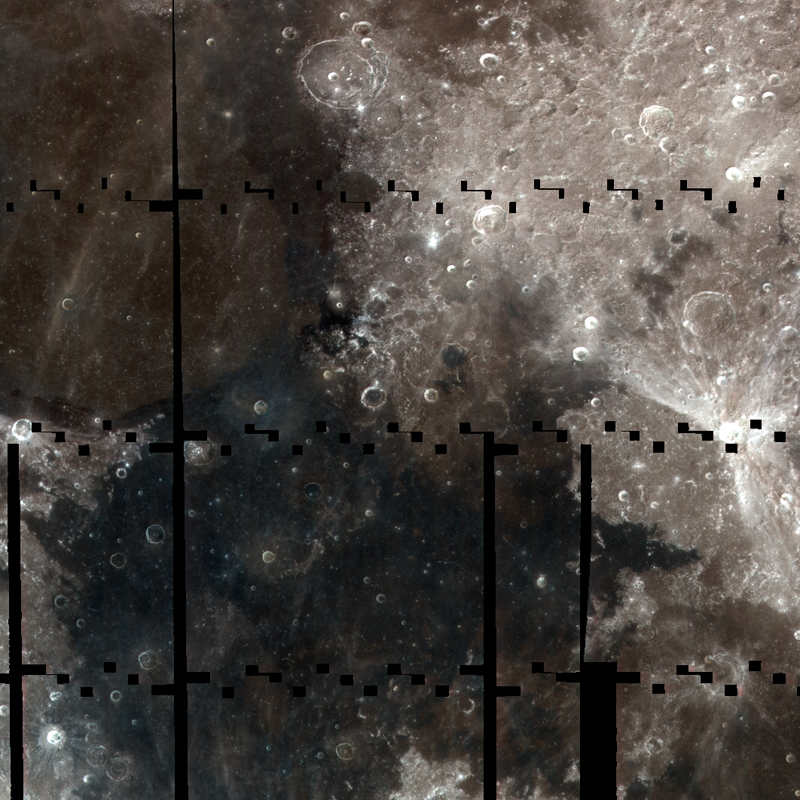
The long gores (black areas) in the WAC mosaic are due to off-nadir slews to acquire NAC stereo observations and the small boxy gores are areas not imaged as the WAC resets between images on an orbit. Since the the viewing angle of the WAC changes from straight down at the center to 30° at the edge in color mode (45° in BW mode) the extreme angle at the edges results in geometric distortion and an apparent change in brightness of the surface. Both effects need to be removed to make mosaics, and the LROC team has been working on corrections since this Spring. If you look closely at some the image edges, you can see slight color fringes. This effect is an artifact of imperfect photometric correction. Over time as more WAC data is collected, the science team can better model the lunar photometric properties and provide improved corrections.
Investigate the Mare Tranquillitatis and Mare Serenitatis region in greater detail.
Published by Mark Robinson on 10 September 2010